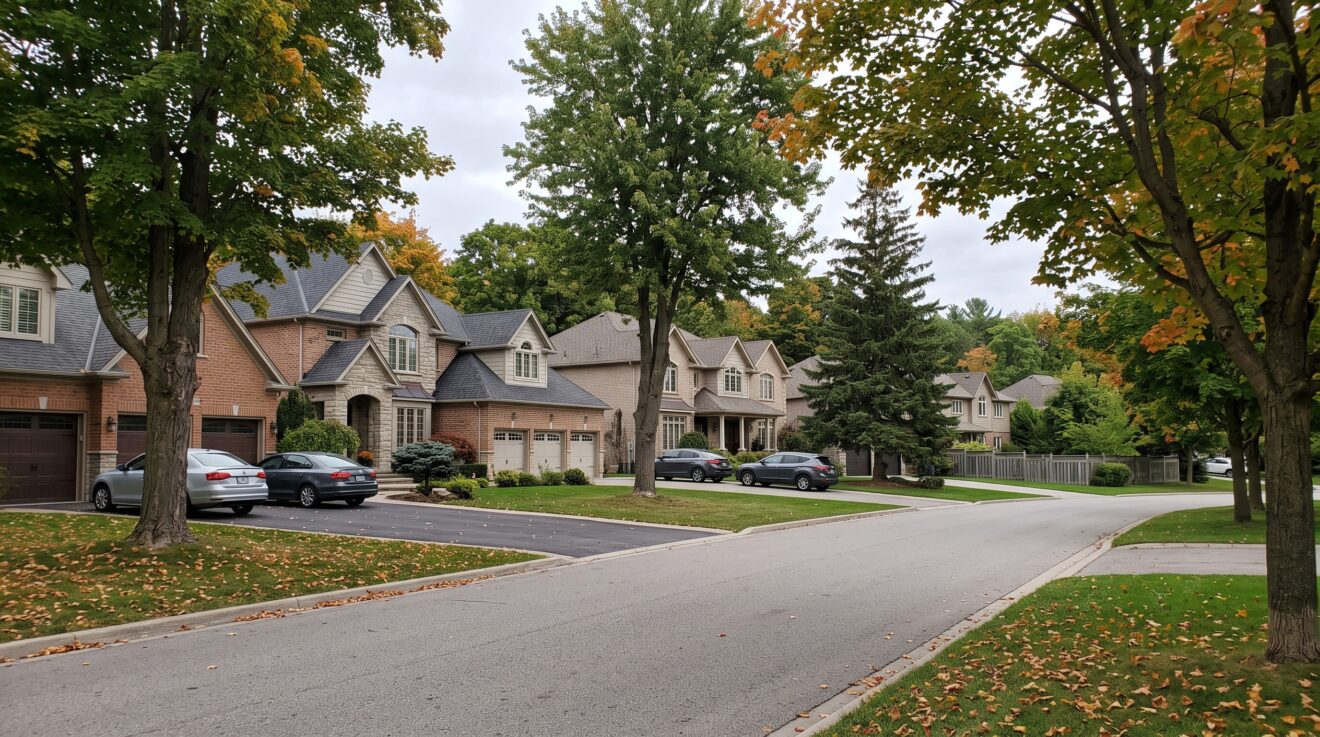
November 4, 2026 | Community: Ancaster
Ancaster Real Estate Market Update: October 2026 Sales Rise as Prices Adjust
Ancaster’s residential real estate market recorded stronger sales activity in October 2026 compared with the same month last year, even as average and median sale prices declined.
According to MLS® statistics extracted from ITSO’s Matrix system on November 2, 2026, 37 freehold residential properties sold in Ancaster during October, compared with 29 in October 2025. That represents a 27.6% year-over-year increase in sales.
However, the average freehold sale price declined from $1,322,710 to $1,180,072, a decrease of approximately 10.8%. The median sale price also declined, although by a smaller 6.4%.
These figures reveal an important distinction: more properties are changing hands, but the homes selling are not necessarily achieving the prices recorded a year earlier.
For buyers, sellers and homeowners in Ancaster, understanding that difference is more useful than relying on a single headline about whether the market is improving or declining.
October 2026 Ancaster Real Estate Market at a Glance
The following comparison summarizes the available MLS® statistics for freehold residential properties and condominiums in Ancaster.
| Market indicator | October 2025 | October 2026 | Change |
| Freehold sales | 29 | 37 | +27.6% |
| Freehold average sale price | $1,322,710 | $1,180,072 | −10.8% |
| Freehold median sale price | $1,165,000 | $1,090,000 | −6.4% |
| Freehold active listings* | 212 | 173 | −18.4% |
| Freehold average days to sell | 39 | 42 | +3 days |
| Freehold median days to sell | 29 | 31 | +2 days |
| Condominium sales | 9 | 2 | −77.8% |
| Condominium average sale price | $732,822 | $657,500 | −10.3% |
| Condominium active listings* | 47 | 33 | −29.8% |
*The Matrix reports label these figures ‘Active Listings, Number of’ within a monthly average-listings report. They should not be interpreted as month-end inventory counts. Source: ITSO Matrix, Ancaster residential statistics, extracted November 2, 2026. Percentages calculated from the reported values.
1. Ancaster Home Sales Increased Despite Lower Average Prices
One of October’s most noteworthy developments was the divergence between sales activity and transaction prices.
Freehold residential sales increased by 27.6% compared with October 2025, while the average sale price declined by approximately $142,638.
That combination is worth examining carefully.
An increase in sales indicates that more transactions were completed during the month. It does not, by itself, establish that buyer demand has strengthened across every price range or property category.
Similarly, a decline in average sale price does not necessarily mean that every individual property in Ancaster has lost 10.8% of its value.
Average prices can be influenced by the composition of properties sold. A month with a greater concentration of lower-priced transactions can produce a lower average even when comparable properties have experienced smaller changes.
The median sale price provides a useful second perspective.
In October 2026, the median freehold sale price was $1,090,000, compared with $1,165,000 one year earlier. This represents a decline of approximately 6.4%.
Because the median identifies the midpoint of the transaction distribution, it is less affected by unusually expensive or inexpensive sales than the average.
The fact that both measures declined supports the conclusion that October’s completed transactions occurred at lower price levels than a year earlier. However, the difference between the two declines also reinforces why transaction composition matters.
What does this mean for Ancaster homeowners?
A property’s market value cannot be determined by applying a municipality-wide percentage change to its previous estimated value.
A detached home in an established neighbourhood, a newer executive property in the Meadowlands and a rural estate on the outskirts of Ancaster may appeal to different purchasers and compete against different listings.
An accurate evaluation should consider recent comparable sales, current competition, property condition, lot characteristics, location and the particular price segment in which the home competes.
2. Fewer Active Listings Did Not Translate Into Faster Sales
Another interesting development was the relationship between available inventory and marketing time.
The monthly active-listings measure declined from 212 in October 2025 to 173 in October 2026, a decrease of approximately 18.4%.
At first glance, fewer listings combined with more completed sales might suggest a market in which properties should be selling more quickly.
However, the marketing-time statistics tell a more complicated story.
The average number of days to sell a freehold property increased from 39 to 42 days year over year.
The median also increased slightly, from 29 to 31 days.
In other words, October recorded more transactions and fewer active listings than a year earlier, but the properties that sold still took marginally longer to secure a sale.
This is a useful reminder that inventory levels alone do not determine how quickly an individual property will sell.
Pricing, condition, presentation, location and competition within a specific price range all influence a home’s marketability.
A property can face relatively little direct competition and still require considerable time to sell if its asking price is not aligned with what comparable properties are achieving.
The distinction between days to sell and cumulative days on market
The MLS® data also provides cumulative days on market, commonly referred to as CDOM.
For Ancaster freehold residential properties, October 2026 recorded:
- Average days to sell: 42 days
- Median days to sell: 31 days
- Average CDOM: 84 days
- Median CDOM: 43 days
The difference is meaningful.
Ordinary marketing-time statistics and cumulative marketing-time statistics measure related but different aspects of the selling process. CDOM is intended to capture cumulative listing exposure under the MLS® system’s applicable rules, including qualifying relisting activity.
The October figures show that cumulative exposure was substantially longer than the ordinary days-to-sell measure.
That does not mean every property was cancelled and relisted, nor does it establish why any particular home remained available.
It does demonstrate why sellers should understand both measures when evaluating a proposed listing strategy.
The O’Reilly Group‘s interpretation: A successful pricing strategy should be evaluated against the entire competitive environment, not simply the asking prices of other homes currently for sale.
Active listings tell us what sellers are hoping to achieve. Completed sales provide evidence of what purchasers have actually paid.
Both matter, but they answer different questions.
3. Ancaster’s Inventory Position Has Changed Since the Beginning of 2026
October’s inventory statistics become more informative when considered alongside the earlier months of the year.
The supplied Matrix reports show that the monthly active-listings measure for freehold residential properties increased during the first half of 2026, reaching approximately 203 to 204 listings during June and July.
By October, that measure had declined to 173.
At the same time, completed freehold sales followed a different pattern.
Sales increased from 28 in January to 45 in May before moderating during the summer. October’s 37 sales represented an increase from September’s 35 transactions.
This is not a straightforward story of either uninterrupted market improvement or deterioration.
Instead, it illustrates how inventory and sales can move independently over relatively short periods.
The relationship between available listings and completed sales is particularly important when assessing market conditions.
A larger selection of properties may create additional alternatives for purchasers. However, those alternatives are not always interchangeable.
For example, a buyer seeking a well-maintained bungalow in an established Ancaster neighbourhood may have relatively few suitable choices even when overall residential inventory appears substantial.
Conversely, several similar homes competing within the same subdivision and price range may create meaningful competition between sellers.
This is why municipality-wide inventory figures are best treated as a starting point rather than a complete description of conditions affecting an individual home.
Other related blogs:
- Ancaster Real Estate Market Update – April 2026
- Why Some Luxury Homes in Ancaster Struggle to Sell – And What Sellers Can Do Differently
- How We Sold a Luxury Home in Ancaster in 10 Days: What Sellers Can Learn From the Strategy
4. Ancaster’s Condominium Market Requires a Different Interpretation
The condominium market produced a particularly important example of why small transaction samples require caution.
Only two condominium residential sales were recorded in Ancaster during October 2026, compared with nine in October 2025.
That represents a 77.8% decline in completed transactions.
The average condominium sale price declined from $732,822 to $657,500, while the median declined from $690,000 to $657,500.
However, with only two sales in October 2026, these figures should not be treated as reliable evidence that the value of a typical Ancaster condominium declined by the same percentages.
A small number of transactions can produce substantial changes in monthly averages and medians depending on which properties happen to sell.
Condominium inventory remained substantial relative to sales
The monthly active-listings measure declined from 47 in October 2025 to 33 in October 2026.
Despite that decline, the supplied Matrix statistics reported 16.5 months of condominium inventory for October 2026.
This was considerably higher than the 5.2 months reported in October 2025 and the 5.6 months reported in September 2026.
Months of inventory is a measure of the relationship between available properties and the current pace of sales. A higher figure indicates more supply relative to transaction activity.
With only two condominium sales during October, however, the calculation is especially sensitive to a small change in sales volume.
It would therefore be premature to interpret the 16.5-month figure as evidence that every condominium property in Ancaster would require that amount of time to sell.
The more useful conclusion is that condominium transaction activity was limited during October, making individual property comparisons particularly important.
For condominium sellers, building characteristics, maintenance fees, unit size, layout, parking, accessibility and the availability of directly comparable alternatives can all influence how a property competes.
For purchasers, the limited number of completed sales means that a broader period of comparable transactions may be necessary to establish a reliable understanding of value.
5. Sale-to-List Price Ratios Show Why Asking Prices Need Context
Another useful indicator is the relationship between a property’s final sale price and its reported list price.
In October 2026, Ancaster freehold residential properties recorded an average close-price-to-list-price ratio of 95.6%.
That compares with 95.9% in October 2025.
For condominium properties, the corresponding ratio was 96.9% in October 2026, compared with 97.2% one year earlier.
Both categories therefore recorded slightly lower ratios than a year earlier.
These differences are relatively small, but the underlying indicator is useful when interpreting completed transactions.
A sale-to-list ratio of 95.6% means the reported sale prices averaged 95.6% of the corresponding list prices under the system’s calculation.
It does not establish that purchasers negotiated an average discount of 4.4% from the property’s original asking price.
A home may have undergone one or more price adjustments before selling, and the ratio does not necessarily capture the entire pricing history.
This distinction matters for both buyers and sellers.
For buyers, the ratio should not be used as a universal formula for determining an offer price.
For sellers, it reinforces the importance of understanding the relationship between the initial asking price, any subsequent adjustments and the eventual sale price.
The most useful analysis is property-specific and considers comparable transactions rather than assuming that every home should sell at a fixed percentage of its asking price.
What October’s Market Means for Ancaster Buyers
For prospective buyers, October’s statistics offer several considerations.
First, stronger freehold sales activity demonstrates that transactions continued to occur despite lower average and median sale prices.
Second, the modest increase in marketing time suggests that purchasers should examine how long a property has been available, particularly when evaluating its asking price relative to comparable sales.
Third, broad market statistics should not replace neighbourhood-level research.
A purchaser comparing properties in Oakhill, the Meadowlands or established areas near Ancaster Village should consider the characteristics of the homes available within their actual search criteria.
The goal should not simply be to negotiate the largest possible reduction from an asking price.
It should be to determine whether the property represents reasonable value based on its condition, location, alternatives and recent comparable transactions.
What October’s Market Means for Ancaster Sellers
For sellers, October’s market provides a useful reminder that increased sales activity does not automatically translate into higher achievable prices.
The 27.6% year-over-year increase in freehold sales is encouraging from a transaction-activity perspective.
However, the decline in average and median prices demonstrates why sellers must distinguish between the number of homes selling and the prices those homes are achieving.
The longer cumulative marketing-time figures also deserve attention.
A seller considering a listing strategy should understand how comparable properties have performed, including those that required price adjustments or extended marketing periods.
A strong listing strategy involves more than selecting an asking price.
It requires evaluating the property’s competitive position, preparing it appropriately, presenting it effectively and responding to actual market evidence throughout the selling process.
For some properties, that may involve competing primarily on price. For others, distinctive architecture, lot characteristics, renovations or location may provide meaningful differentiation.
The correct strategy depends on the property.
What Existing Ancaster Homeowners Should Understand
For homeowners who are not actively planning to sell, monthly market statistics can still provide useful context.
However, they should not be confused with an individual property appraisal.
The October 2026 average freehold sale price of $1,180,072 represents the average of the properties that sold during that month.
It does not establish the average value of every freehold home in Ancaster.
Likewise, the median sale price of $1,090,000 describes the midpoint of completed transactions, not the value of a standardized or representative property.
Homeowners considering refinancing, downsizing, renovating or relocating should place greater weight on comparable properties and longer-term evidence than on any single month’s average price.
For those considering a move within Ancaster, the relationship between the value of their current home and the cost of their next property may be more important than either figure in isolation.
What to Watch in the November 2026 Ancaster Real Estate Market
The next monthly report will provide an opportunity to assess whether October’s developments continue.
Several indicators deserve particular attention:
- Freehold sales activity: Whether transaction volume remains above the comparable period in 2025.
- Average and median prices: Whether both measures continue moving in the same direction and how transaction composition may affect them.
- Active inventory: Whether the monthly listing measure continues declining or begins increasing.
- Marketing time: Whether ordinary and cumulative days on market move closer together or remain substantially different.
- Condominium transactions: Whether a larger number of sales provides a more meaningful basis for interpreting condominium prices and supply.
These indicators should be evaluated together rather than independently.
One month’s statistics can reveal an important development. Several months of consistent evidence provide a stronger foundation for interpreting the market.
Final Thoughts: A More Active Market Still Requires Careful Pricing
October 2026 demonstrated that Ancaster‘s residential real estate market cannot be adequately described by a single statistic.
Freehold sales increased, average and median sale prices declined, the monthly active-listings measure was lower than a year earlier, and marketing times increased modestly.
Meanwhile, the condominium market recorded very few transactions, making its monthly price and inventory measures especially sensitive to individual sales.
The broader lesson is that market activity and market value are related, but they are not interchangeable.
For buyers, sellers and homeowners, the most useful information comes from understanding how these statistics apply to a particular property, neighbourhood and price range.
Luke O’Reilly, Founder & Real Estate Broker of The O’Reilly Group at Royal LePage State Realty, works with buyers and sellers throughout Ancaster and the surrounding Hamilton region.
Whether you are considering selling, purchasing or simply want a clearer understanding of your property’s current market position, The O’Reilly Group can help you evaluate the available evidence and develop a strategy appropriate to your circumstances.
Frequently Asked Questions About the Ancaster Real Estate Market
1. What was the average home price in Ancaster in October 2026?
The average sale price for freehold residential properties in Ancaster was $1,180,072 in October 2026, according to the supplied ITSO Matrix statistics. This represented a decrease of approximately 10.8% from October 2025, when the average was $1,322,710. The figure applies specifically to completed freehold residential transactions and should not be interpreted as the average value of every home in Ancaster.
2. Are home prices falling in Ancaster?
October 2026 recorded lower average and median freehold sale prices than October 2025. The average declined approximately 10.8%, while the median declined approximately 6.4%. However, these are transaction-price measures, not constant-quality home-value indexes. Changes in the types, sizes and locations of properties sold can affect both statistics. Determining whether a particular home has declined in value requires comparable-sales analysis.
3. How many homes sold in Ancaster in October 2026?
A total of 37 freehold residential properties were sold in Ancaster during October 2026, compared with 29 in October 2025. That represents an increase of approximately 27.6%. An additional two condominium residential sales were recorded, bringing the combined total for these two ownership categories to 39 transactions. These figures reflect the specific residential ownership categories included in the supplied Matrix reports.
4. How long does it take to sell a house in Ancaster?
In October 2026, freehold residential properties that sold in Ancaster recorded an average of 42 days to sell and a median of 31 days. The average cumulative days on market was 84 days. These figures describe completed transactions rather than guaranteeing how long a newly listed property will require. Actual marketing time depends on factors including asking price, property condition, location, presentation and competition.
5. Is Ancaster a buyer’s market or a seller’s market?
The October statistics provide mixed signals rather than a definitive classification for every property category. Freehold sales increased year over year, while average and median sale prices declined and marketing times rose modestly. The condominium market recorded 16.5 months of inventory, but only two sales, making that figure unusually sensitive to transaction volume. A reliable assessment should consider supply, sales activity and pricing within the specific property category and price range.
6. What is happening in Ancaster’s condominium market?
Only two condominium residential properties sold in Ancaster during October 2026, compared with nine a year earlier. The average condominium sale price was $657,500, and the reported months of inventory reached 16.5. Because the number of transactions was exceptionally small, monthly price changes should be interpreted cautiously. Buyers and sellers should examine a broader set of comparable condominium sales rather than relying exclusively on October’s average.
7. Are homes in Ancaster selling below asking price?
The average close-price-to-list-price ratio for Ancaster freehold residential properties was 95.6% in October 2026. This indicates that completed transactions, on average, closed below their corresponding reported list prices. However, it does not establish the average reduction from the original asking price, since properties may have undergone price adjustments. The appropriate offer or listing strategy depends on the specific property’s comparable sales and pricing history.
8. Should I wait until 2027 to buy or sell a home in Ancaster?
October’s statistics do not provide enough evidence to determine whether waiting until 2027 would produce a better financial outcome. Market conditions may change, and individual circumstances often matter more than short-term fluctuations. Buyers should consider affordability, financing, available properties and long-term plans. Sellers should evaluate current competition, property-specific market value and their intended next move before deciding when to list.
Sources and Methodology
This analysis is based on 20 supplied ITSO Matrix statistical reports covering October 2025 through October 2026, extracted November 2, 2026.
The reports use the following search criteria:
- Region: Hamilton
- Municipality/Area: 42 – Ancaster
- Property type: Residential
- Ownership categories: Freehold/None and Condominium, reported separately
- Reporting period: October 2025 to October 2026
The reports include sales volume, average and median sale prices, active-listings measures, ordinary days to sell, cumulative days on market, close-price-to-list-price ratios and condominium months of inventory.
Year-over-year changes in this article were calculated from the underlying reported values. The statistics are not seasonally adjusted.
The freehold reports identify 422 listings in their sales-related calculations, while the condominium reports identify 92. Inventory-related reports use different underlying listing populations.
The data does not include a standardized MLS® Home Price Index benchmark, new-listings series or sales-to-new-listings ratio. These indicators have therefore not been inferred.
Important limitations: Average and median transaction prices can be affected by sales composition. The small number of condominium transactions makes that segment’s monthly statistics particularly volatile. The supplied reports describe Ancaster only and should not be generalized to Hamilton as a whole, Dundas or Burlington.
This is independent market commentary prepared by The O’Reilly Group using ITSO Matrix data. It is not an official market report issued by ITSO or Cornerstone.
The O’Reilly Group is a member of Royal LePage Canada’s ‘National Chairman’s Club’, recognizing The O’Reilly Group as one of Canada’s top performing real estate teams.

We're On Your Side
Whether you’re selling or buying the O’Reilly Group is dedicated to elevating your real estate experience.